Knowledge base How to view and use the spend by billing and shipping country dashboards
By Insight Editor / 18 Dec 2020
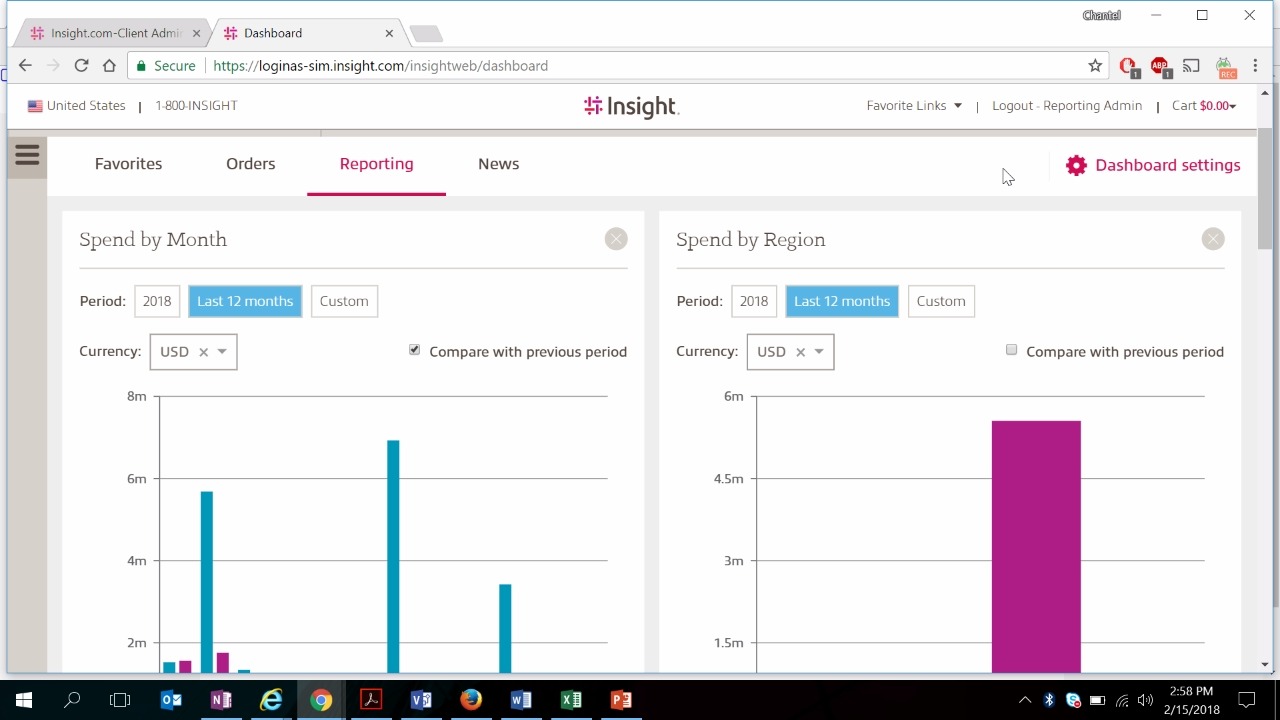
Track and monitor your spend by billing and shipping country with dashboards on myInsight. View and analyze your spend by month, year to date (YTD) or a custom date range. Compare your desired datasets month over month (MoM) or year over year (YoY). Action items allow you to filter results further or export data all within an intuitive, easy-to-use interface.
Step 1: Access your dashboards
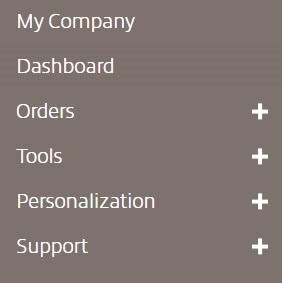
After logging in to your myInsight account, within the secondary navigation menu, select Dashboard.
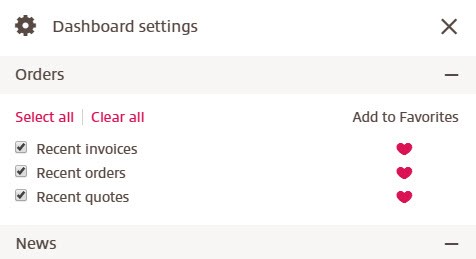
Step 2: Ensure dashboard settings are enabled for these widgets
To view the spend dashboard, ensure you have the spend by billing country or spend by shipping country checkbox selected in your dashboard settings. Access your settings by selecting the gear icon to open the settings menu.
Using the dashboard
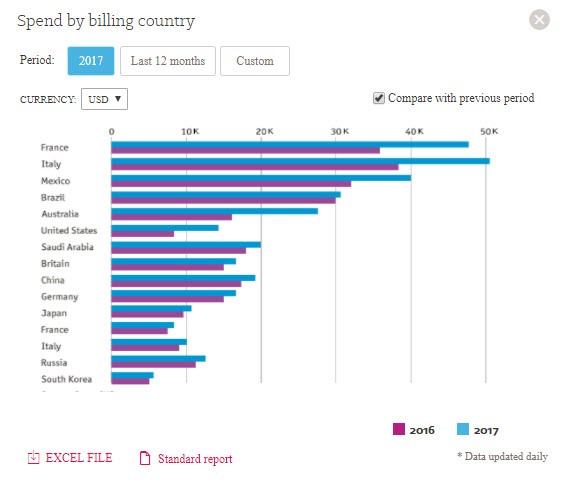
This drag-and-drop widget can be placed anywhere on your dashboard. The dashboard will initially populate data from the current year. Data is updated daily.
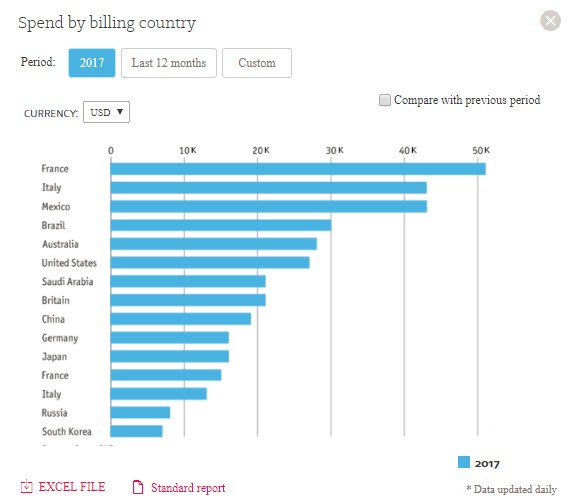
Filtering and comparing results on the billing and shipping country dashboards
Select last 12 months or custom action buttons to change the dates of the report. The compare with previous period checkbox will provide you with an additional bar graph of either MoM or YoY results, depending on the date range selected.
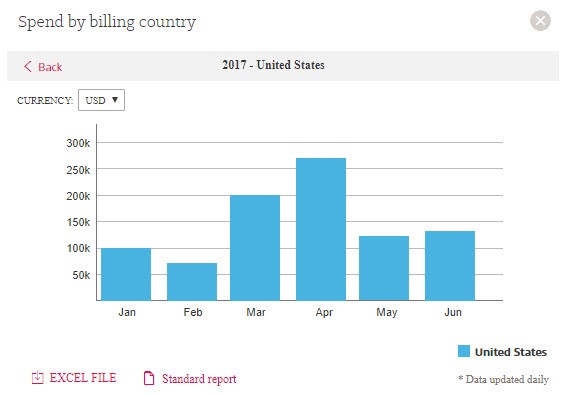
Narrowing down spend by country to display data by month
Selecting the bar graph of a specific country will narrow down spend data into a breakdown by month. Hovering your mouse over a bar graph will display spend details in the selected currency. Use the currency drop-down menu to change your currency view.
Reporting Dashboard